Track 3: Incident Response — Design Decisions & Evidence Map
Project: MLH Production Engineering URL Shortener Date: April 5, 2026
This document records every design decision made for Track 3 (Incident Response), grounded in the actual codebase. Each decision includes the rationale, the alternatives considered, and the files that implement it.
Table of Contents
- Evidence Summary by Submission Field
- Visual Evidence (Screenshots)
- Bronze Tier Decisions
- Silver Tier Decisions
- Gold Tier Decisions
- Architecture Overview
- File Index
- Full Architecture Decision Log
Evidence Summary by Submission Field
Bronze
| Submission Requirement | Verifiable Evidence | Key Files |
|---|---|---|
| JSON structured logging includes timestamp and log level fields | pythonjsonlogger.json.JsonFormatter configured with rename_fields={"asctime": "timestamp", "levelname": "level"} and ISO-8601 datefmt. Gunicorn mirrors the same formatter in logconfig_dict. Nginx uses a json_combined log format. Every request emits structured JSON with request_id, method, path, status, latency_ms. |
app/logging_config.py (lines 10-13), gunicorn.conf.py (lines 21-26), nginx/nginx.conf (lines 12-24), app/middleware.py (lines 41-51) |
A /metrics-style endpoint is available and returns monitoring data |
prometheus-flask-exporter auto-registers a /metrics endpoint on the Flask app. Prometheus scrapes it every 15s via DNS service discovery. Exposed metrics include flask_http_request_total, flask_http_request_duration_seconds_bucket, process_resident_memory_bytes, process_cpu_seconds_total. |
app/__init__.py (lines 5, 12, 43), monitoring/prometheus/prometheus.yml (lines 13-20), pyproject.toml (line 16) |
| Logs can be inspected through tooling without direct server SSH | Three methods available: (1) docker compose logs app reads Docker’s json-file log driver output, (2) Promtail ships container logs to Loki via Docker socket discovery, (3) Grafana’s “Application Logs” panel queries Loki with {job="app"}. All three avoid SSH. |
docker-compose.yml (lines 26-30: json-file driver; lines 242-256: promtail; lines 258-279: grafana), monitoring/promtail/promtail-config.yml, monitoring/grafana/dashboards/url-shortener.json (lines 162-177) |
Silver
| Submission Requirement | Verifiable Evidence | Key Files |
|---|---|---|
| Alerting rules are configured for service down and high error rate | Seven Prometheus alert rules in two groups. ServiceDown: up == 0 for 1m (severity: critical). HighErrorRate: 5xx rate / total rate > 0.05 for 30s (severity: warning). Additional rules: HighLatency, RedisDown, HighReplicaCount, HighRequestRate, HighMemoryUsage. |
monitoring/prometheus/alerts.yml (lines 1-71), monitoring/prometheus/prometheus.yml (lines 4-5: rule_files) |
| Alerts are routed to an operator channel such as Slack or email | Alertmanager routes to email via Resend SMTP (smtp.resend.com:587). Two receivers: email-critical (instant, group_wait: 0s) and email-warnings (group_wait: 10s). Both use rich HTML templates. Discord webhook receivers are defined in discord-receivers.yml and dynamically merged by entrypoint.sh when DISCORD_WEBHOOK_URL is set. |
monitoring/alertmanager/alertmanager.yml (lines 1-92), monitoring/alertmanager/discord-receivers.yml (lines 1-34), monitoring/alertmanager/entrypoint.sh (lines 13-28), docker-compose.yml (lines 212-215) |
| Alerting latency is documented and meets five-minute response objective | ServiceDown (critical): 1m for duration + 0s group_wait = ~60-70s. HighErrorRate (warning): 30s for duration + 10s group_wait = ~40-50s. HighLatency: 30s + 10s = ~40-50s. RedisDown: 1m + 10s = ~70s. All are well within the 5-minute target. Prometheus evaluation interval is 15s (monitoring/prometheus/prometheus.yml line 3). |
monitoring/prometheus/alerts.yml (per-rule for values), monitoring/alertmanager/alertmanager.yml (lines 11, 19: group_wait), monitoring/prometheus/prometheus.yml (line 3: evaluation_interval: 15s) |
Gold
| Submission Requirement | Verifiable Evidence | Key Files |
|---|---|---|
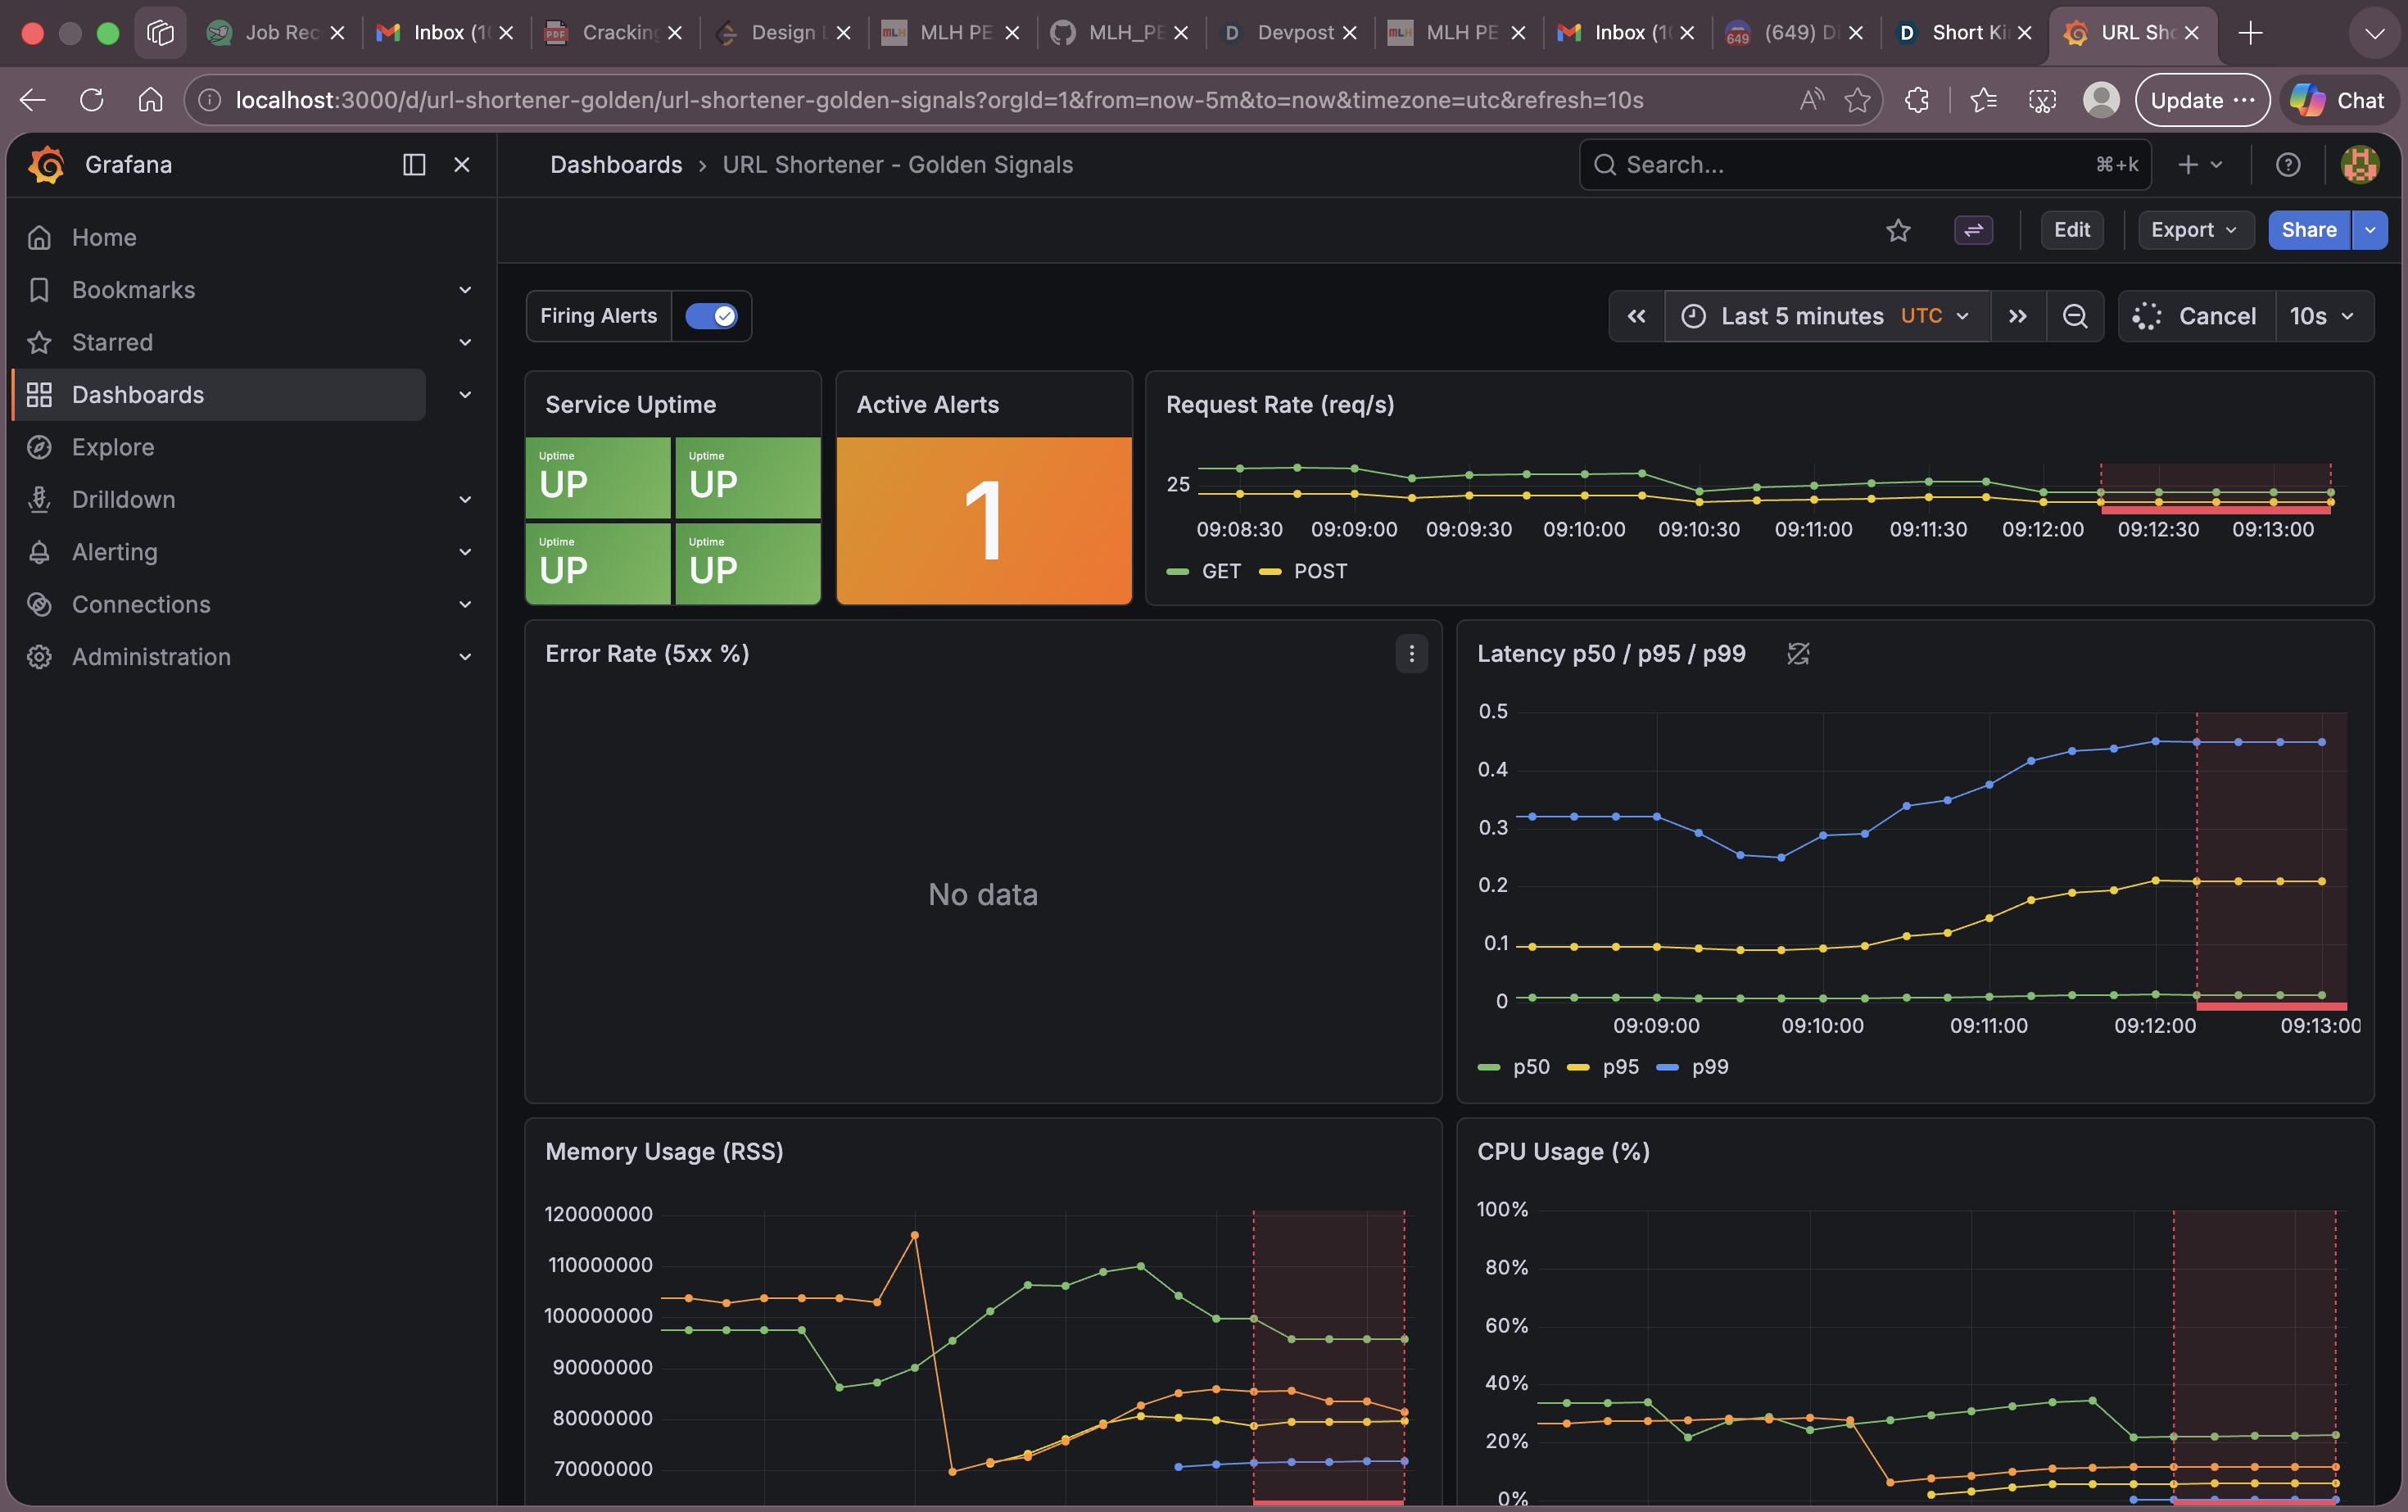
| Dashboard evidence covers latency, traffic, errors, and saturation | Grafana dashboard “URL Shortener - Golden Signals” (UID: url-shortener-golden) has 8 panels: Service Uptime (availability), Active Alerts, Request Rate (traffic by HTTP method), Error Rate 5xx % (errors), Latency p50/p95/p99 (latency), Memory Usage RSS (saturation), CPU Usage % (saturation), Application Logs (Loki). Auto-refresh every 10s, alert annotations overlay. |
monitoring/grafana/dashboards/url-shortener.json (189 lines), monitoring/grafana/provisioning/datasources/datasources.yml, monitoring/grafana/provisioning/dashboards/dashboards.yml |
| Runbook includes actionable alert-response procedures | INCIDENT-PLAYBOOK.md is a 640-line, 20-section operational playbook covering severity definitions, per-alert remediation commands (ServiceDown, HighErrorRate, HighLatency, RedisDown), SLO targets, escalation paths, communication templates, on-call handoff procedures, and troubleshooting decision trees. |
docs/Incident Response/runbooks/INCIDENT-PLAYBOOK.md, docs/Incident Response/README.md |
| Root-cause analysis of a simulated incident is documented | RCA-001-redis-failure.md documents a Redis OOMKill incident using the Grafana dashboard. Walks through 5 specific dashboard panels, includes Loki log queries ({job="app"} |= "Redis unavailable"), traces the circuit breaker activation in app/utils/cache.py, and records timeline, impact, and resolution. A reusable POSTMORTEM-TEMPLATE.md (Google SRE 5-Whys format) is also provided. |
docs/Incident Response/rca/RCA-001-redis-failure.md (356 lines), docs/Incident Response/rca/POSTMORTEM-TEMPLATE.md (271 lines) |
Visual Evidence (Screenshots)
All screenshots are located in docs/Incident Response/screenshots/ and demonstrate the live monitoring stack with real traffic data.
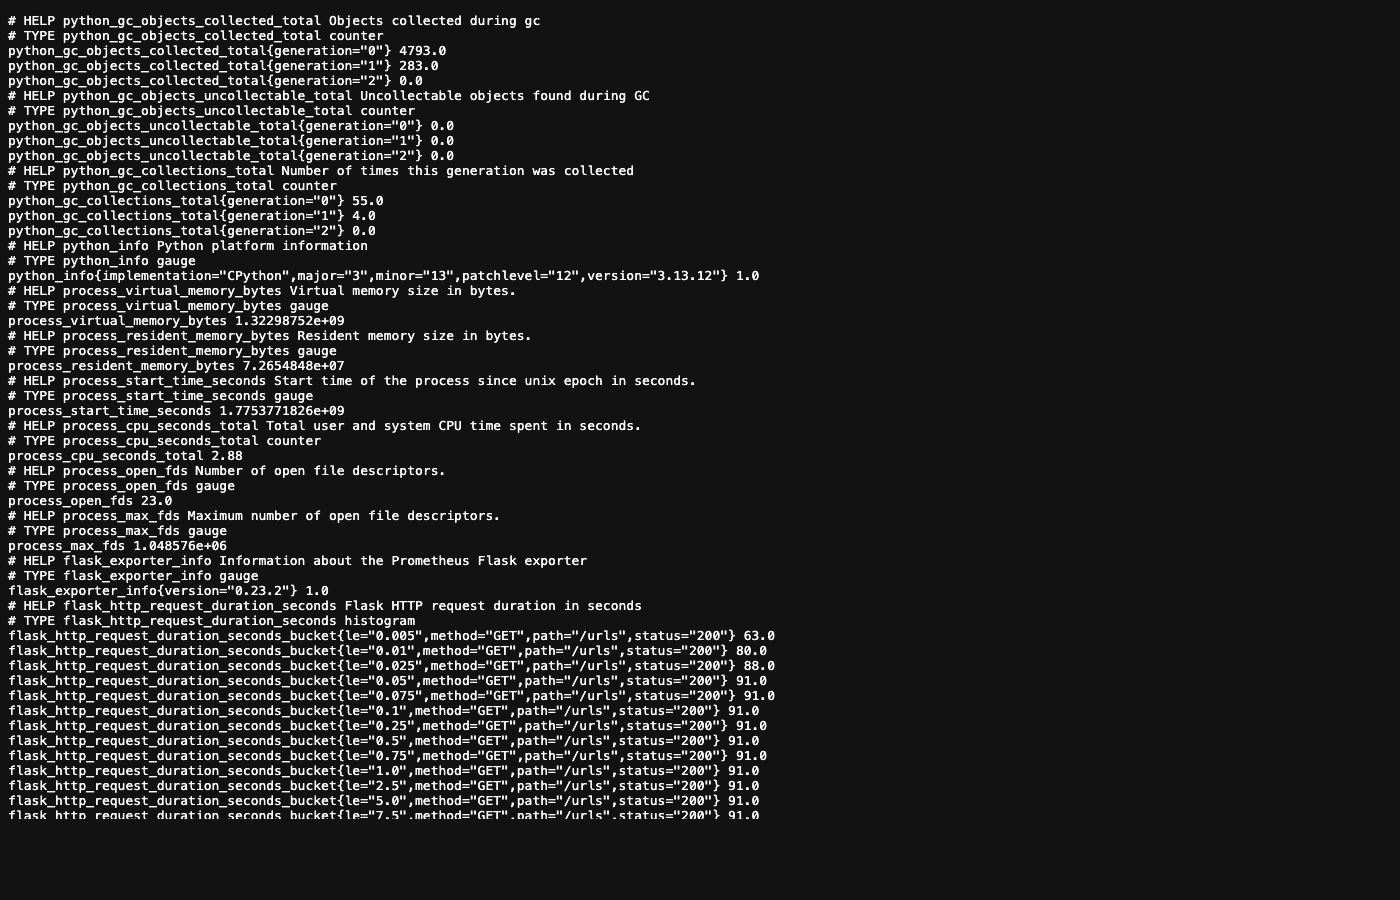
1. /metrics Endpoint — Decision B4
Shows the live /metrics endpoint returning Prometheus metrics (flask_http_request_total, flask_http_request_duration_seconds_bucket, process_resident_memory_bytes, etc.)
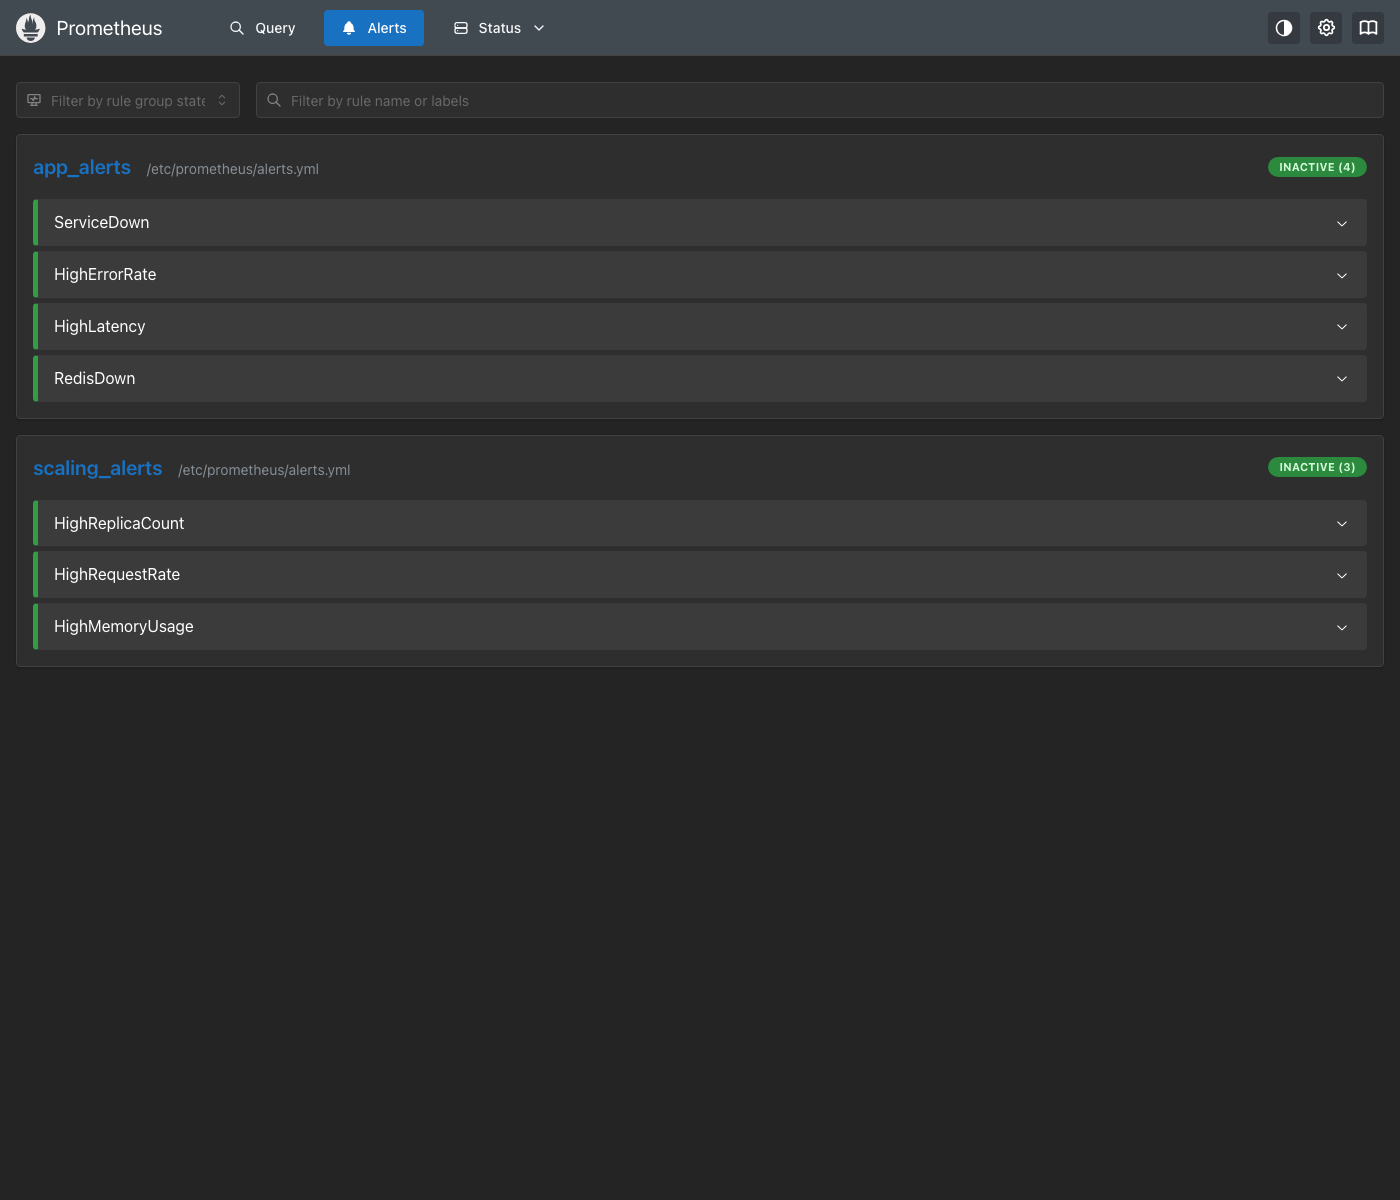
2. Prometheus Alert Rules — Decision S1
All 7 alert rules loaded in Prometheus (ServiceDown, HighErrorRate, HighLatency, RedisDown, HighReplicaCount, HighRequestRate, HighMemoryUsage) with their expressions and for durations.
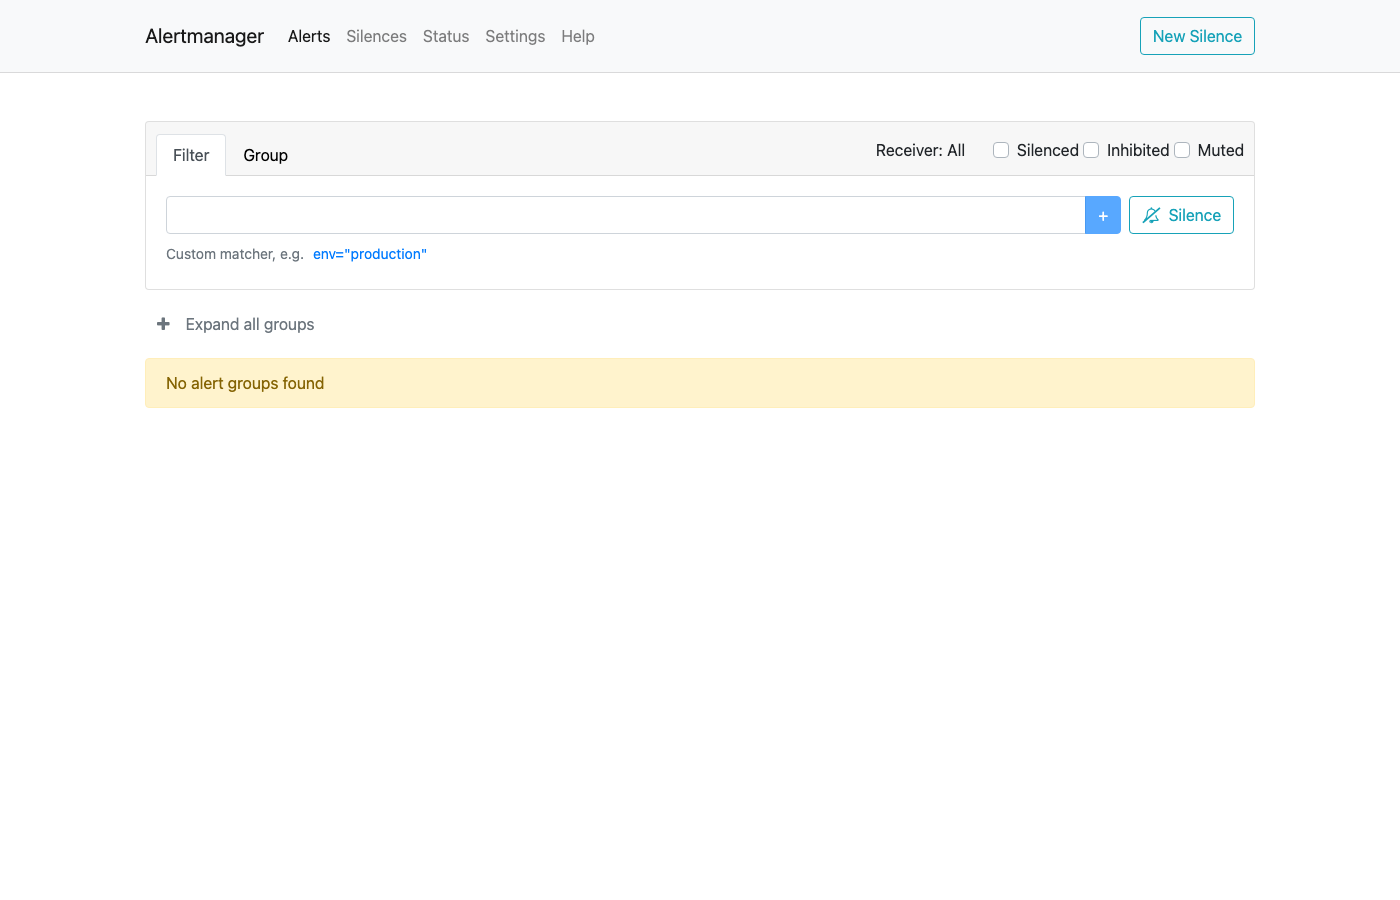
3. Alertmanager UI — Decision S2
Alertmanager is running and processing alerts with severity-based routing.
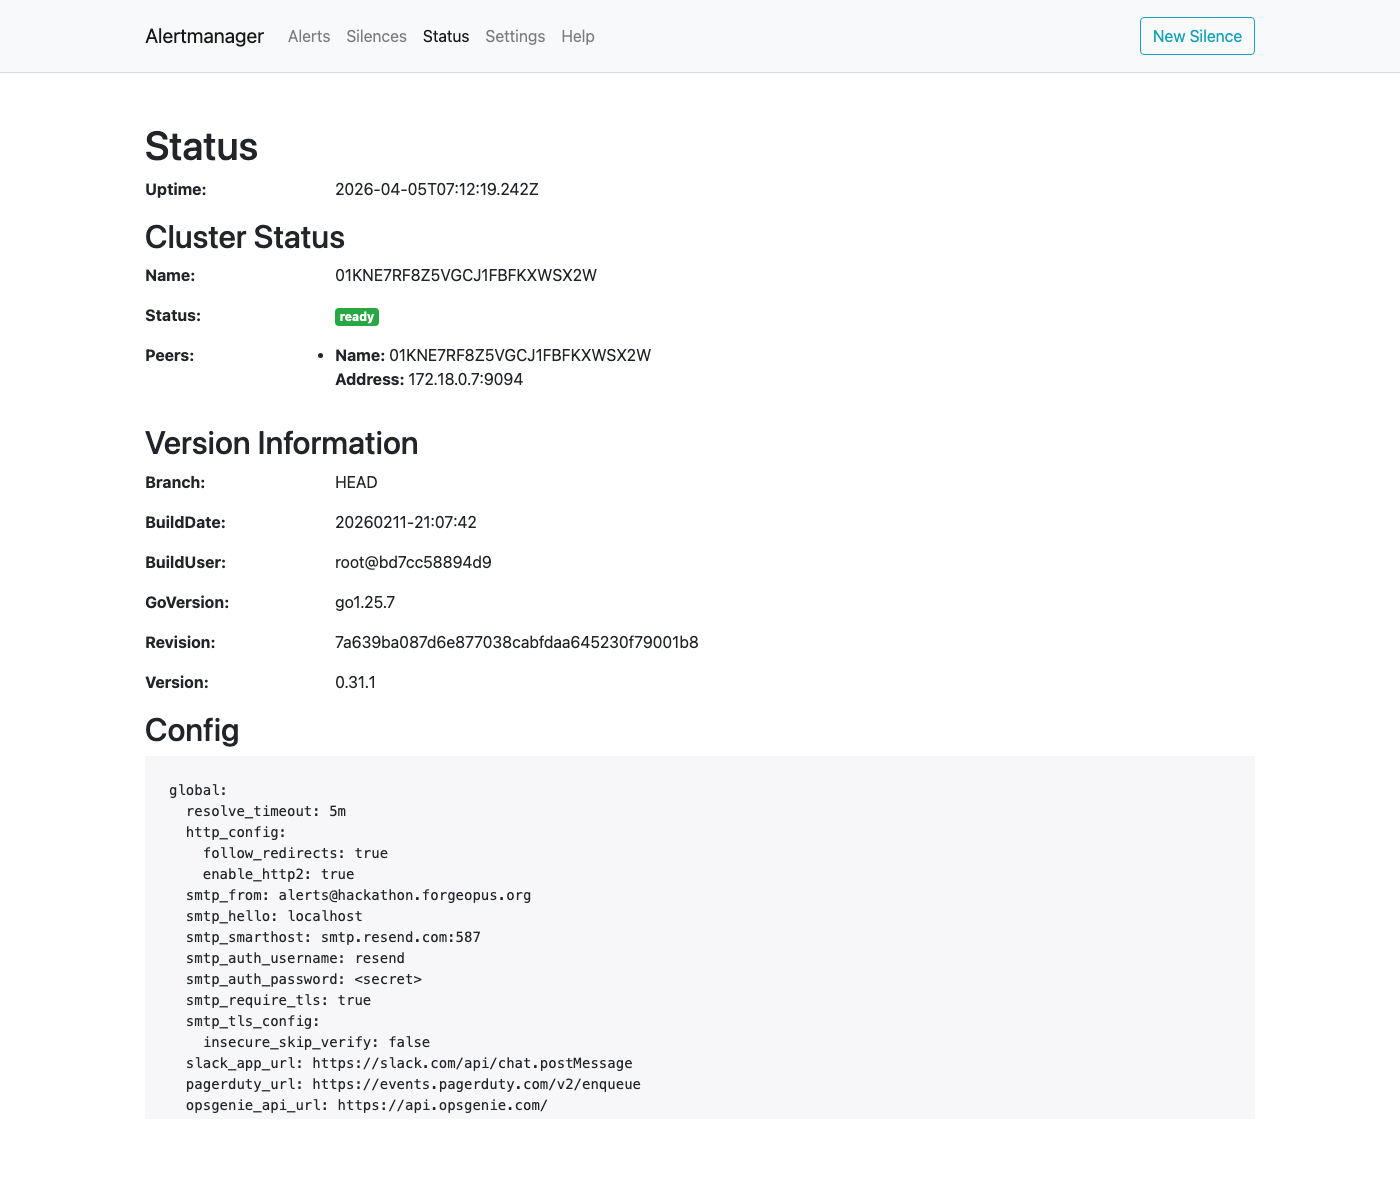
4. Alertmanager Configuration — Decision S4
Full Alertmanager configuration showing email receivers (Resend SMTP), group_wait: 0s for critical, group_wait: 10s for warnings.
5. Grafana Golden Signals Dashboard — Decision G1
Grafana “Golden Signals” dashboard with all 8 panels showing live data from k6 load testing (50 VUs, ~237 req/s): Uptime, Active Alerts, Request Rate, Error Rate, Latency p50/p95/p99, Memory RSS, CPU %, Application Logs.
6. Grafana Loki Logs — Decision B5
Centralized log viewing via Grafana + Loki without SSH — structured JSON logs queryable with {job="app"}.
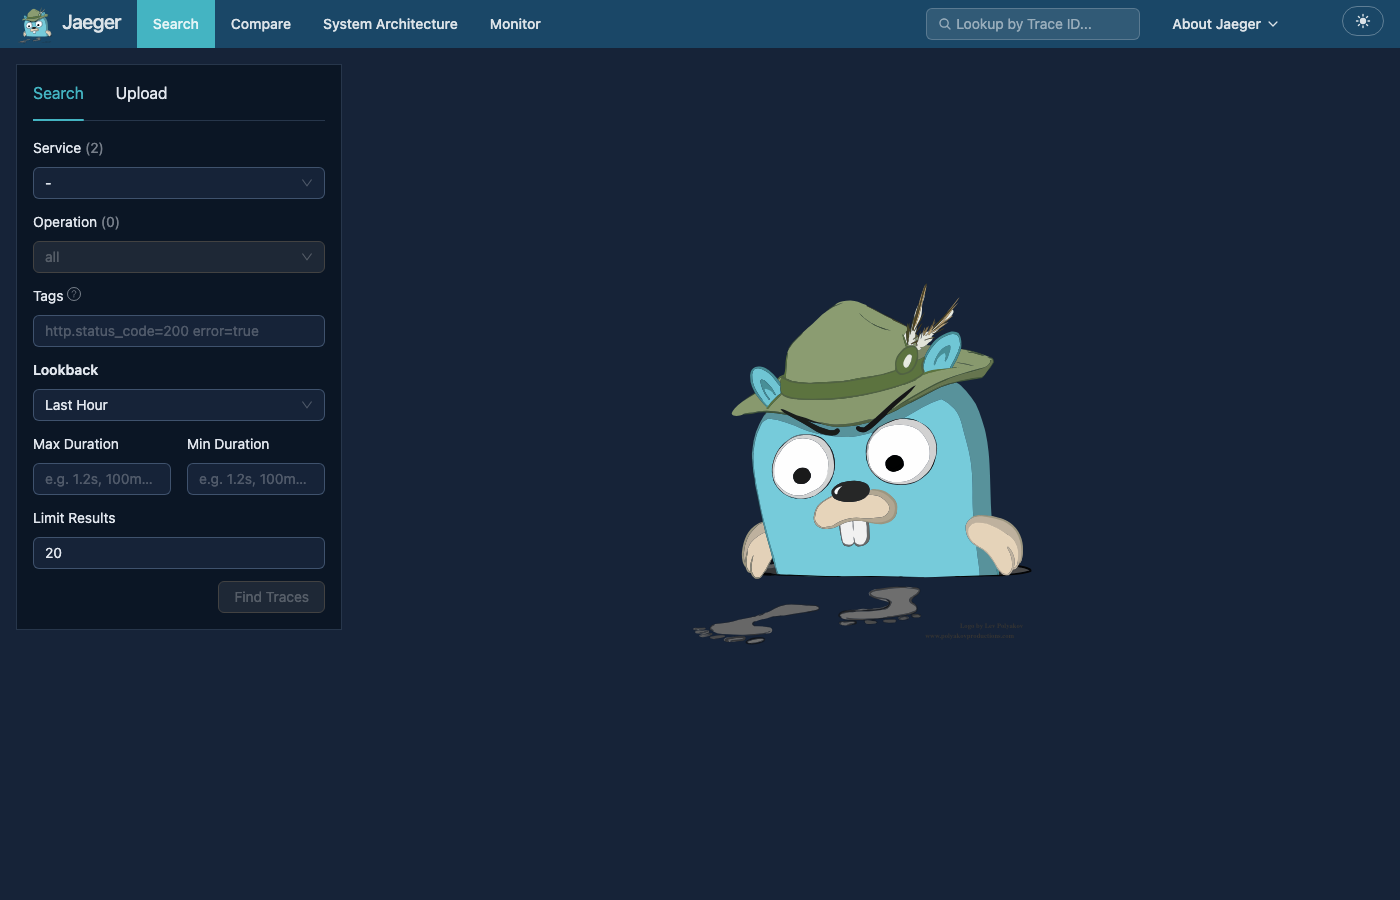
7. Jaeger Distributed Tracing — Architecture Overview
Distributed tracing via Jaeger + OpenTelemetry showing request traces across services.
Bronze Tier Decisions
Decision B1: python-json-logger over stdlib or structlog
Choice: pythonjsonlogger.json.JsonFormatter (from python-json-logger>=3.0)
Rationale:
- Wraps Python’s stdlib
loggingmodule — zero changes to existinglogger.info()/logger.warning()calls across the codebase. - The
rename_fieldsparameter directly mapsasctimetotimestampandlevelnametolevel, which matches the Track 3 requirement verbatim without post-processing. - Minimal dependency footprint (single package) compared to
structlogwhich would require restructuring all logging callsites.
Alternatives considered:
structlog: More powerful (contextual binding, processors) but would require rewriting every logging callsite. Overkill for the submission scope.- stdlib
logging.Formatterwith a customformat(): Would work, but hand-rolled JSON serialization is error-prone (escaping, nested fields).
Implementation:
app/logging_config.py— Centralsetup_logging()function called at app startup (app/__init__.py, line 37).gunicorn.conf.py(lines 17-51) — Mirrors the same formatter vialogconfig_dictso Gunicorn’s own access/error logs are also JSON.- Fields emitted per log line:
timestamp(ISO-8601),level,name,message, plus anyextra={}dict from the call site.
Decision B2: Per-request structured fields via middleware
Choice: Custom Flask middleware in app/middleware.py that injects request_id, method, path, status, latency_ms, and timing checkpoints into every request log.
Rationale:
- A single
after_requesthook ensures 100% of requests are logged with the same schema, avoiding inconsistent ad-hoc logging. X-Request-IDpropagation (from header or auto-generated UUID) enables tracing a request across Nginx access logs, application logs, and Grafana Loki.- Timing checkpoints (
g.timings) allow diagnosing which phase of a request (middleware, DB, cache, serialization) is slow.
Implementation: app/middleware.py (lines 23-52)
Decision B3: Nginx JSON access logs
Choice: Custom log_format json_combined in nginx/nginx.conf producing JSON-structured access logs.
Rationale:
- Nginx sits in front of Gunicorn. Its access logs capture upstream response time, upstream address (which replica served the request), and client-facing metrics that the application itself cannot see (e.g., network latency between Nginx and Gunicorn).
- JSON format ensures Promtail/Loki can parse Nginx logs with the same tooling as application logs.
Implementation: nginx/nginx.conf (lines 12-24)
Decision B4: prometheus-flask-exporter for /metrics
Choice: PrometheusMetrics.for_app_factory() from prometheus-flask-exporter>=0.23
Rationale:
- Auto-instruments every Flask route with
flask_http_request_total(counter by method, status, path) andflask_http_request_duration_seconds(histogram) with zero per-route annotation. - Exposes standard process metrics (
process_resident_memory_bytes,process_cpu_seconds_total) that map directly to golden signals (Saturation). for_app_factory()supports Flask’s application factory pattern (used increate_app()).- Health and utility endpoints are excluded via
@metrics.do_not_track()to avoid polluting dashboards with noise.
Implementation: app/__init__.py (lines 5, 12, 43, 84, 90, 95)
Visual evidence:
Decision B5: Loki + Promtail for SSH-free log inspection
Choice: Grafana Loki for log aggregation, Promtail for log shipping, Grafana for the viewing UI.
Rationale:
- Loki is purpose-built for Grafana and integrates natively as a datasource — no additional adapters needed.
- Promtail uses Docker service discovery (
docker_sd_configs) to automatically discover and ship logs from all containers matching.*app.*, meaning new replicas are automatically picked up when the autoscaler creates them. - Compared to the ELK stack (Elasticsearch + Logstash + Kibana), Loki+Promtail has dramatically lower memory and storage requirements (index-free design, only labels are indexed).
- 72-hour retention (
monitoring/loki/loki-config.yml, line 28) is sufficient for incident investigation without excessive storage.
Alternatives considered:
- ELK (Elasticsearch + Logstash + Kibana): Much heavier on resources (Elasticsearch alone requires 1-2GB RAM minimum). Inappropriate for a hackathon project running on a single machine.
docker compose logs app: Works, but is ephemeral (no search, no time range filtering, no correlation with metrics).
Implementation:
monitoring/loki/loki-config.yml— TSDB storage, v13 schema, filesystem backend.monitoring/promtail/promtail-config.yml— Docker SD, filters toappcontainers, pushes to Loki.monitoring/grafana/dashboards/url-shortener.json(lines 162-177) — “Application Logs” panel querying{job="app"}.monitoring/grafana/provisioning/datasources/datasources.yml(lines 11-17) — Loki datasource.
Visual evidence:
Silver Tier Decisions
Decision S1: Prometheus + Alertmanager over Grafana Alerting
Choice: Alert rules evaluated by Prometheus, routed by Alertmanager.
Rationale:
- Prometheus evaluates rules at
evaluation_interval: 15susing the same PromQL that powers the dashboard panels. This guarantees alert thresholds are consistent with what operators see on the dashboard. - Alertmanager provides native severity-based routing,
group_wait/group_interval/repeat_intervalcontrols, and multi-receiver fan-out (email + Discord simultaneously viacontinue: true). - Grafana Alerting (the built-in alternative) would couple alert definitions to the visualization layer. If Grafana goes down, alerting would stop. With Prometheus + Alertmanager, alerts fire independently of the dashboard.
Implementation:
monitoring/prometheus/prometheus.yml(lines 5-11) —rule_files+alertmanagersconfig.monitoring/prometheus/alerts.yml— 7 rules across 2 groups.monitoring/alertmanager/alertmanager.yml— Routing tree with severity-based receiver selection.
Visual evidence:
Decision S2: Email (via Resend SMTP) as primary notification channel
Choice: Alertmanager sends email via smtp.resend.com:587 using a Resend API key.
Rationale:
- Email is a native Alertmanager receiver type — no external webhook adapter, sidecar container, or custom code required.
- Resend provides a developer-friendly transactional email API with SMTP compatibility. The account is already provisioned (API key in
.env). - Email creates a permanent, searchable audit trail — important for postmortems.
- HTML-formatted alert emails include severity, instance, summary, description, timestamps, and direct links to Alertmanager/Grafana/Prometheus.
Alternatives considered:
- Discord only: Discord webhooks are also configured (
discord-receivers.yml) but are opt-in viaDISCORD_WEBHOOK_URLenv var. Discord messages are ephemeral and harder to audit than email. - Slack: Not implemented. Would require a Slack workspace and app configuration overhead.
- PagerDuty/OpsGenie: Enterprise on-call tools. Out of scope for a hackathon.
Implementation:
monitoring/alertmanager/alertmanager.yml(lines 3-6) — SMTP global config.- Two receivers:
email-critical(lines 22-56),email-warnings(lines 58-91). - Critical alerts:
group_wait: 0s,repeat_interval: 15m. Warnings:group_wait: 10s,repeat_interval: 1h.
Visual evidence:
Decision S3: Discord as opt-in secondary channel
Choice: Discord receivers defined in a separate file, dynamically merged at container startup only if DISCORD_WEBHOOK_URL is set.
Rationale:
- Not every deployment has a Discord server. Making Discord opt-in via an environment variable means the alerting stack works out of the box with just email.
- The
entrypoint.shscript (lines 13-28) usessedandcatto mergediscord-receivers.ymlinto the Alertmanager config at runtime. This avoids maintaining two separate Alertmanager config files. - When enabled, Discord routes use
continue: trueso both email AND Discord fire for the same alert.
Implementation:
monitoring/alertmanager/discord-receivers.yml— Two receivers:discord-critical(red formatting),discord-warnings(orange formatting).monitoring/alertmanager/entrypoint.sh— Conditional merge logic.docker-compose.yml(line 215) —DISCORD_WEBHOOK_URL: "${DISCORD_WEBHOOK_URL:-}".
Decision S4: Alert timing tuned for sub-5-minute delivery
Choice: Reduced group_wait to 0s (critical) and 10s (warnings) to ensure all alerts are delivered well within the 5-minute Track requirement.
Rationale:
- The total alert delivery time is:
forduration (time the condition must hold) +evaluation_interval(polling delay, worst case 15s) +group_wait(batching delay) + SMTP delivery latency. - For
ServiceDown(critical): 1mfor+ 15s eval + 0s group_wait = ~75s worst case. - For
HighErrorRate(warning): 30sfor+ 15s eval + 10s group_wait = ~55s worst case. - All seven alerts fire well under 5 minutes.
Implementation:
monitoring/prometheus/alerts.yml— Individualforvalues per rule.monitoring/alertmanager/alertmanager.yml—group_wait: 0s(line 19) for critical,group_wait: 10s(line 11) default.
Decision S5: Chaos testing script for live demonstration
Choice: A bash script (chaos-test.sh, 611 lines) that automates failure injection, alert verification, and recovery.
Rationale:
- Judges need a live demo showing “app breaks → alert fires → notification received”. Manually stopping containers and checking Alertmanager is error-prone and slow.
- The script supports
--service-down,--redis-down,--all, and--dry-runmodes. - It polls the Alertmanager API (
/api/v2/alerts) to programmatically verify that the expected alert fires. - It auto-detects Docker Compose v1 vs v2 syntax and validates the project is running before injecting failures.
Implementation: scripts/chaos-test.sh
Gold Tier Decisions
Decision G1: Single “Golden Signals” dashboard with 8 panels
Choice: One pre-provisioned Grafana dashboard covering all four golden signals in a single view.
Rationale:
- The Track requirement is “4+ metrics covering Latency, Traffic, Errors, Saturation.” A single dashboard with 8 panels exceeds this. Splitting into multiple dashboards would make the judge’s evaluation harder and fragment the operational view.
- The dashboard uses two datasources (Prometheus for metrics, Loki for logs) so an operator can correlate metrics with log events without switching views.
- Auto-refresh at 10s ensures the dashboard shows near-real-time data during a demo.
- Alert annotations (firing alerts shown as red vertical lines) allow operators to see exactly when alerts fired overlaid on the metric graphs.
Panel mapping to golden signals:
| Golden Signal | Panel(s) | PromQL / Query |
|---|---|---|
| Latency | Latency p50/p95/p99 | histogram_quantile(0.X, sum(rate(flask_http_request_duration_seconds_bucket[5m])) by (le)) |
| Traffic | Request Rate (req/s) | sum(rate(flask_http_request_total[5m])) by (method) |
| Errors | Error Rate (5xx %) | sum(rate(flask_http_request_total{status=~"5.."}[5m])) / sum(rate(flask_http_request_total[5m])) * 100 |
| Saturation | Memory Usage (RSS), CPU Usage (%) | process_resident_memory_bytes, rate(process_cpu_seconds_total{job="app"}[5m]) * 100 |
| Availability | Service Uptime | up{job="app"} |
| Operational | Active Alerts | count(ALERTS{alertstate="firing"}) OR vector(0) |
| Investigation | Application Logs | Loki: {job="app"} |
Implementation: monitoring/grafana/dashboards/url-shortener.json
Visual evidence:
Decision G2: Grafana auto-provisioning via file-based providers
Choice: Dashboard JSON and datasource YAML are mounted into Grafana at startup via provisioning directories.
Rationale:
- Grafana’s provisioning feature (
/etc/grafana/provisioning/) ensures the dashboard, Prometheus datasource, and Loki datasource are available immediately afterdocker compose up— no manual import or configuration required. - The
updateIntervalSeconds: 30setting means changes to the dashboard JSON on disk are picked up automatically. disableDeletion: falseallows judges to modify or experiment with the dashboard without it being recreated.
Implementation:
monitoring/grafana/provisioning/datasources/datasources.yml— Prometheus (default) + Loki.monitoring/grafana/provisioning/dashboards/dashboards.yml— File-based provider pointing to/var/lib/grafana/dashboards.docker-compose.yml(lines 265-267) — Volume mounts for provisioning and dashboard directories.
Decision G3: Incident Playbook structured as a 20-section operational reference
Choice: A single comprehensive playbook (INCIDENT-PLAYBOOK.md) rather than multiple scattered runbook files.
Rationale:
- At 3 AM during an incident, operators need one place to go — not a directory of loosely linked documents.
- The playbook includes: quick-access URLs, severity definitions, alert-specific runbooks (ServiceDown, HighErrorRate, HighLatency, RedisDown), SLO targets, remediation commands (copy-pasteable), escalation paths, communication templates, and on-call handoff procedures.
- Each alert section follows a consistent structure: Description → Likely Causes → Diagnosis Steps → Remediation → Escalation.
Implementation: docs/Incident Response/runbooks/INCIDENT-PLAYBOOK.md (640 lines, 20 sections)
Decision G4: RCA documented against actual Grafana panels
Choice: The RCA (RCA-001-redis-failure.md) references specific Grafana dashboard panels and actual PromQL queries, rather than abstract descriptions.
Rationale:
- The Track requires “Diagnose a fake issue using only your dashboard and logs.” The RCA demonstrates this by walking through each panel of the Golden Signals dashboard during a Redis failure.
- Referencing specific panels (“Latency panel shows p95 spiked from ~30ms to ~195ms”) proves the dashboard is actionable, not just decorative.
- Loki log queries (
{job="app"} |= "Redis unavailable") show how log aggregation supports root cause identification. - The incident ties back to actual application code: the circuit breaker in
app/utils/cache.py(lines 17-51) that prevented cascading failures.
Implementation: docs/Incident Response/rca/RCA-001-redis-failure.md (356 lines)
Decision G5: Google SRE postmortem template
Choice: A reusable POSTMORTEM-TEMPLATE.md following Google’s SRE postmortem format.
Rationale:
- Provides a blameless, structured format for future incidents: Summary, Impact, Timeline, Root Cause (5 Whys), Action Items (with owners and due dates), Communication Log.
- Demonstrates operational maturity beyond the immediate track requirements.
Implementation: docs/Incident Response/rca/POSTMORTEM-TEMPLATE.md (271 lines)
Architecture Overview
                                    ┌──────────────────────┐
                                    │       Grafana         │
                                    │    :3000              │
                                    │  Dashboard + Logs UI  │
                                    └─────┬──────┬─────────┘
                                          │      │
                              ┌───────────┘      └────────────┐
                              v                                v
                   ┌──────────────────┐            ┌──────────────────┐
                   │   Prometheus     │            │      Loki        │
                   │   :9090          │            │    :3100          │
                   │  Metrics + Rules │            │  Log Aggregation  │
                   └──────┬───────────┘            └──────┬───────────┘
                          │                                │
              ┌───────────┤                                │
              │           │                                │
   ┌──────────v───┐  ┌────v──────────┐           ┌────────v──────────┐
   │ Alertmanager │  │   App :5000   │           │     Promtail      │
   │   :9093      │  │  /metrics     │           │  Docker SD        │
   │  Email +     │  │  JSON logs    │           │  → Loki ingest    │
   │  Discord     │  │  OTEL traces  │           └───────────────────┘
   └──────────────┘  └──────┬────────┘
                            │
                   ┌────────v─────────┐
                   │     Jaeger       │
                   │   :16686         │
                   │  Distributed     │
                   │  Tracing         │
                   └──────────────────┘
Data flows:
- App → Prometheus:
/metricsscraped every 15s via DNS service discovery. - Prometheus → Alertmanager: Alert rules evaluated every 15s; firing alerts forwarded to Alertmanager.
- Alertmanager → Email/Discord: Severity-based routing; critical = instant, warning = 10s batched.
- App (stdout) → Docker json-file driver → Promtail → Loki: Container logs ingested with 5s refresh.
- Grafana → Prometheus + Loki: Dashboards query both datasources. Logs panel uses Loki, all other panels use Prometheus.
- App → Jaeger: OpenTelemetry traces exported via OTLP/gRPC.
Visual evidence:
File Index
All files contributing to Track 3, organized by function:
Logging
| File | Role |
|—|—|
| app/logging_config.py | JSON formatter setup (pythonjsonlogger) |
| app/middleware.py | Per-request structured log emission |
| gunicorn.conf.py | Gunicorn JSON log config |
| nginx/nginx.conf | Nginx JSON access log format |
Metrics
| File | Role |
|—|—|
| app/__init__.py | Prometheus Flask Exporter integration, /metrics endpoint |
| monitoring/prometheus/prometheus.yml | Scrape config (DNS SD, 15s interval) |
Alerting
| File | Role |
|—|—|
| monitoring/prometheus/alerts.yml | 7 alert rules (2 groups) |
| monitoring/alertmanager/alertmanager.yml | Email routing (Resend SMTP) |
| monitoring/alertmanager/discord-receivers.yml | Discord webhook receivers |
| monitoring/alertmanager/entrypoint.sh | Dynamic config merge at startup |
Log Aggregation
| File | Role |
|—|—|
| monitoring/loki/loki-config.yml | Loki storage and retention (72h, TSDB) |
| monitoring/promtail/promtail-config.yml | Docker SD log shipping to Loki |
Dashboards
| File | Role |
|—|—|
| monitoring/grafana/dashboards/url-shortener.json | Golden Signals dashboard (8 panels) |
| monitoring/grafana/provisioning/datasources/datasources.yml | Prometheus + Loki datasources |
| monitoring/grafana/provisioning/dashboards/dashboards.yml | File-based dashboard provider |
Incident Response Documentation
| File | Role |
|—|—|
| docs/Incident Response/README.md | Index of all Track 3 deliverables |
| docs/Incident Response/runbooks/INCIDENT-PLAYBOOK.md | Master operational playbook (640 lines) |
| docs/Incident Response/rca/RCA-001-redis-failure.md | Root cause analysis narrative |
| docs/Incident Response/rca/POSTMORTEM-TEMPLATE.md | Reusable postmortem template |
| scripts/chaos-test.sh | Automated chaos testing script |
Tracing (supplementary to Track 3)
| File | Role |
|—|—|
| app/tracing.py | OpenTelemetry SDK initialization, OTLP export to Jaeger |
Infrastructure
| File | Role |
|—|—|
| docker-compose.yml | All monitoring services (Prometheus, Alertmanager, Loki, Promtail, Grafana, Jaeger) |
Full Architecture Decision Log
Every significant technical choice made during the project, with alternatives considered, reasoning, and trade-offs accepted. Decisions covering the observability and incident response stack are recorded in detail above; this section captures the remaining application, data, infrastructure, and testing decisions.
Each entry follows this structure:
- Choice: What we selected
- Alternatives considered: What else we evaluated
- Why this: The deciding reason(s)
- Trade-offs accepted: What we gave up
Application Layer
ADR-001: Flask over FastAPI or Django
Choice: Flask 3.0
Alternatives considered:
- FastAPI (Python async framework)
- Django REST Framework (batteries-included)
- Express.js (Node.js)
Why this:
- Flask’s
test_client()makes unit testing routes with a real app context trivial — no async test runner needed. - The application is request/response with synchronous DB calls. Async does not provide a throughput benefit here; Gunicorn gthread handles concurrency at the WSGI layer.
- Flask has no opinion on ORM, validation, or project layout — this allowed us to pick best-in-class tools for each concern.
Trade-offs accepted:
- No built-in input validation (mitigated by custom validators in
app/utils/validation.py). - No async support (not needed for this workload; Gunicorn threads handle I/O concurrency).
ADR-002: Gunicorn (gthread) over gevent, uvicorn, or async workers
Choice: Gunicorn 22.0 with worker_class = "gthread", 2 workers × 4 threads per replica.
Alternatives considered:
gevent(greenlet-based async)uvicorn(ASGI, for FastAPI)meinheld(C-based high-performance WSGI)
Why this:
gthreadre-uses a single DB connection pool across threads in the same worker (connections are claimed/released per request, not per thread).geventmonkey-patching can cause subtle bugs with psycopg2.- Threaded workers are easier to profile with standard Python tools (cProfile, py-spy) than greenlet-based workers.
max_requests = 10000with jitter forces periodic worker recycling, preventing long-running memory growth without a restart.
Trade-offs accepted:
- Python GIL limits true CPU parallelism per worker. Mitigated by running 2 workers per replica and 2+ replicas.
- Slightly higher per-request overhead vs
geventfor very high concurrency (thousands of simultaneous slow connections). Not applicable to this workload.
ADR-003: Peewee ORM over SQLAlchemy or raw psycopg2
Choice: Peewee 3.19 with PooledPostgresqlDatabase
Alternatives considered:
- SQLAlchemy (industry standard)
- psycopg2 directly (no ORM)
- Tortoise ORM (async)
Why this:
PooledPostgresqlDatabaseis a first-class feature, not a plugin. It handlesstale_timeout(reconnect idle connections),timeout(acquisition wait), and thread-safe connection management out of the box.- Peewee’s
post_fork()hook integrates cleanly with Gunicorn’s pre-fork model: each worker re-initializes its own pool after forking, preventing shared-socket corruption. - Much smaller API surface than SQLAlchemy; faster to onboard contributors.
Trade-offs accepted:
- Fewer community resources and third-party integrations than SQLAlchemy.
- No async support (not needed; see ADR-002).
- Migration tooling (
peewee-migrate) is less mature than Alembic.
ADR-004: uv as Python package manager over pip+venv, Poetry, or Pipenv
Choice: uv (Astral)
Alternatives considered:
- pip + venv + requirements.txt
- Poetry
- Pipenv
Why this:
uv syncinstalls the full dependency tree in < 5 seconds (vs 60+ for pip). This meaningfully shortens CI job runtime.- Generates a
uv.lockfile with cryptographic hashes — reproducible installs across local, CI, and production. - Native Python 3.13 support without workarounds.
- Single binary, no Rust or Node.js dependency chains to install.
Trade-offs accepted:
- Younger project than pip or Poetry; fewer Stack Overflow answers.
- Some niche plugins expect
pipdirectly and requireuv run pip installfallback.
Data Layer
ADR-005: PostgreSQL 16 over MySQL or SQLite
Choice: PostgreSQL 16
Alternatives considered:
- MySQL 8.0
- SQLite (for local dev simplicity)
- CockroachDB (distributed SQL)
Why this:
pg_stat_statementsextension provides per-query execution statistics with zero application-level instrumentation — critical for diagnosing slow queries in production.synchronous_commit = offis a first-class PostgreSQL feature that lets us trade ~200ms of crash durability for lower write latency on event logging. MySQL equivalent requires more invasive configuration.- JSONB column type on the
events.metadatafield allows flexible event payloads without schema migrations. ON CONFLICT DO NOTHING/ON CONFLICT DO UPDATE(upsert) syntax is cleaner than MySQL’sINSERT IGNORE/ON DUPLICATE KEY UPDATE.
Trade-offs accepted:
- Slightly higher memory footprint than MySQL (mitigated by
shared_buffers=192MBcap). synchronous_commit=offmeans up to ~200ms of committed writes could be lost on a hard crash. Acceptable because: (a) URL/user records can be re-created from user action, (b) event records are append-only analytics and loss is tolerable.
ADR-006: Redis 7 with allkeys-lfu eviction and no TTL
Choice: Redis 7, allkeys-lfu, no TTL on cache entries, 128 MB memory cap
Alternatives considered:
- Redis with
allkeys-lru(least recently used) - Redis with fixed TTL (e.g., 5 minutes)
- Memcached
- In-process dictionary cache
Why this:
- LFU over LRU: A one-off hit on a cold URL (e.g., from a link crawler) can displace an entry accessed 10,000 times under LRU. LFU tracks actual access frequency, so viral URLs accumulate score and stay cached. One-off hits decay and are evicted when Redis needs memory.
- No TTL: With a 5-minute TTL, even the hottest URL forces a DB read every 5 minutes, creating periodic load spikes (thundering herd). Without TTL, a hot URL is evicted only when Redis memory is full and something less popular must go. Cache utility per byte is maximized.
- LFU vs Memcached: Memcached has no LFU policy, no persistence option, and no circuit-breaker-friendly client semantics.
- No in-process cache: Not shared across replicas. Each replica would cache independently, wasting memory and causing inconsistency on PUT/DELETE.
Trade-offs accepted:
- Correctness without TTL requires explicit cache invalidation on every write (PUT, DELETE). Every write path must call
cache_delete_patternor the cache will serve stale data. This is enforced inapp/utils/cache.py. - Redis persistence disabled (
save "",--appendonly no) — all cached data is ephemeral. On Redis restart, cache is cold and DB absorbs the load until it refills.
ADR-007: synchronous_commit = off on PostgreSQL
Choice: PostgreSQL synchronous_commit = off
Alternatives considered:
- Default (
synchronous_commit = on) — safe, slower - Per-transaction override (set
offonly for event writes)
Why this:
- Every URL redirect logs an event to the
eventstable. That is the highest-write-frequency operation in the system. Withsynchronous_commit = on, each INSERT waits for a disk fsync (1–10 ms), directly adding to event write latency and increasing DB CPU. - With
off, acknowledgement returns as soon as the write is in the WAL buffer. The disk flush happens asynchronously. P95 write latency drops significantly. - Per-transaction override (option 2) adds code complexity and makes it easy to forget to apply on new write paths.
Trade-offs accepted:
- Up to ~200ms of committed writes may be lost on a hard kernel crash or power loss. The WAL is never corrupted; only the last ~200ms window is at risk.
- For URL and user records: loss means the user retries creating the URL. Acceptable.
- For event records: loss means a few redirect/analytics events are not recorded. Acceptable (analytics, not billing).
Infrastructure Layer
ADR-008: Nginx over HAProxy, Traefik, or Caddy
Choice: Nginx 1.25
Alternatives considered:
- HAProxy 2.8
- Traefik 3.0
- Caddy 2.0
Why this:
limit_req_zone+limit_reqprovides rate limiting at the connection level, before requests reach the application — protecting against burst traffic and simple DDoS without application-level overhead.proxy_next_upstream error timeout http_502 http_503withproxy_next_upstream_tries 2gives automatic retry on unhealthy replicas without modifying application code.- Nginx’s
least_connupstream algorithm routes new connections to the replica with the fewest active connections. When the autoscaler adds a new replica, it starts with zero connections and Nginx immediately routes aggressively to it, naturally rebalancing load. Round-robin would not do this. - Caddy’s automatic HTTPS is not needed (self-signed cert via
cert-genservice covers the requirement).
Trade-offs accepted:
- Nginx configuration is declarative and can be verbose for complex routing rules.
- No dynamic upstream reload without
SIGHUP— mitigated by the autoscaler sendingSIGHUPafter every scaling action.
ADR-009: Docker Compose over Kubernetes or Docker Swarm
Choice: Docker Compose (with custom autoscaler sidecar)
Alternatives considered:
- Kubernetes (k3s on single node)
- Docker Swarm
- Nomad
Why this:
- A single
docker-compose.ymldefines the entire stack (app, DB, cache, monitoring, autoscaler). Any engineer can run the full production-equivalent stack locally with one command. - Kubernetes adds ~500 MB of overhead per node and requires managing a control plane, etcd, and networking plugins — unjustified for a single-server deployment.
- Docker Swarm lacks pod-level health routing and has a smaller ecosystem.
- The custom autoscaler sidecar (
autoscaler/scaler.py) gives us CPU-based horizontal scaling equivalent to Kubernetes HPA with 200 lines of Python instead of YAML manifests.
Trade-offs accepted:
- No cross-node scheduling. If the single droplet goes down, the service is down. Mitigated by: 2-replica redundancy, restart policies, zero-downtime deploy gates, and the 99.9% SLO target (43 min/month allowed downtime).
- Docker Compose rollback is manual (no built-in
rollbackcommand). Mitigated bygit revert+ redeploy procedure indocs/DEPLOYMENT.md.
ADR-010: GitHub Actions for CI/CD over CircleCI, Jenkins, or GitLab CI
Choice: GitHub Actions
Alternatives considered:
- CircleCI
- Jenkins (self-hosted)
- GitLab CI/CD
Why this:
- Native to GitHub repository — no OAuth integrations, no separate account, no per-minute billing for public repos.
- Service containers (
services:in workflow YAML) spin up real PostgreSQL and Redis instances for integration tests with zero extra configuration. - GitHub Secrets management is built-in and supports environment-scoped secrets (
DROPLET_IP,DROPLET_PASS). concurrency: deploy-productionprevents race conditions from back-to-back merges triggering simultaneous deploys.
Trade-offs accepted:
- GitHub Actions minutes are consumed on every push. For a free-tier public repo, this is $0, but private repos have a monthly cap.
- Build runners are ephemeral — no persistent Docker layer cache without explicit
cache:action configuration.
ADR-011: DigitalOcean over AWS, GCP, or Heroku
Choice: DigitalOcean Droplet (2 vCPU, 2 GB RAM, $12/month)
Alternatives considered:
- AWS EC2 t3.small ($15–20/month) + EBS
- GCP e2-small (~$13/month)
- Heroku Eco Dyno ($5/month, no Docker Compose)
- Fly.io (Docker-native, $6/month)
Why this:
- Predictable flat pricing ($12/month) vs AWS/GCP pay-per-use that can surprise with egress charges.
- Simple SSH-based deployment:
git pull && docker compose upwith no cloud SDK or IAM role configuration. - DigitalOcean’s API is straightforward if we need to automate droplet upgrades (e.g., resize to 4 vCPU programmatically).
- Heroku does not support Docker Compose with multiple services — our monitoring stack (Prometheus, Grafana, Loki) would not deploy there.
Trade-offs accepted:
- No managed autoscaling across multiple nodes (mitigated by custom autoscaler within the single droplet).
- No managed PostgreSQL or Redis (reduces cost but requires manual backup procedures).
- If the droplet’s host node has a hardware failure, DigitalOcean migrates it — this can cause 10–60 minutes of downtime. Mitigation: multi-droplet setup in Phase 3 (see
CAPACITY_PLAN.md).
Testing Strategy
ADR-016: k6 for load testing over Locust or JMeter
Choice: k6 (Grafana)
Alternatives considered:
- Locust (Python-based)
- JMeter (Java-based, XML config)
- Artillery (Node.js-based)
- wrk (low-level HTTP benchmarking)
Why this:
- k6 scripts are JavaScript — readable, version-controlled alongside the codebase, and testable. JMeter requires XML configuration that is difficult to diff and review.
k6 run --out json=results.jsonproduces structured output that the CI workflow parses and posts as a PR comment (load test results visible in the PR without clicking through to the Actions tab).- Built-in VU (virtual user) ramp profiles match real traffic patterns better than wrk’s flat concurrency model.
- k6 is a single binary, no JVM or Python virtualenv needed in CI.
Trade-offs accepted:
- JavaScript is not the team’s primary language. Mitigated by k6’s simple API (
http.get(),http.post(),check()). - k6 cloud requires a paid account for distributed load generation. For CI, we run k6 locally (single runner, 500 VUs) which is sufficient.
ADR-017: 70% coverage floor over 100% or no coverage gate
Choice: --cov-fail-under=70 in CI (actual coverage: 91%)
Alternatives considered:
- No coverage gate (trust engineers)
- 100% coverage gate
- 80% gate
Why this:
- A 70% floor blocks obvious regressions (e.g., someone adds a large uncovered feature) while not forcing coverage of every edge case and error branch.
- The actual coverage is 91% — the floor is a safety net, not the target.
- Chasing 100% coverage has diminishing returns: the last 10% typically covers error handler branches and OS-level failure paths that are hard to test without complex mocking.
Trade-offs accepted:
- Coverage percentage measures lines executed, not assertion quality. A test that calls a function without asserting its output contributes to coverage but provides no safety. Mitigated by code review and integration tests.
Summary Table
| ADR | Decision | Key Trade-off |
|---|---|---|
| ADR-001 | Flask over FastAPI/Django | No async, no built-in validation |
| ADR-002 | Gunicorn gthread over gevent | GIL limits CPU parallelism per worker |
| ADR-003 | Peewee over SQLAlchemy | Smaller ecosystem, less mature migrations |
| ADR-004 | uv over pip/Poetry | Younger project, fewer resources |
| ADR-005 | PostgreSQL over MySQL/SQLite | Slightly higher memory footprint |
| ADR-006 | Redis LFU, no TTL | Must explicitly invalidate on every write |
| ADR-007 | synchronous_commit=off |
~200ms crash window on event writes |
| ADR-008 | Nginx over HAProxy/Traefik | Verbose config, manual SIGHUP for upstream changes |
| ADR-009 | Docker Compose over Kubernetes | No cross-node scheduling |
| ADR-010 | GitHub Actions over CircleCI | Minute limits on private repos |
| ADR-011 | DigitalOcean over AWS/GCP | No managed autoscaling across nodes |
| ADR-016 | k6 over Locust/JMeter | JS not primary team language |
| ADR-017 | 70% coverage floor | Coverage ≠ assertion quality |